As the release of a government report on unidentified aerial phenomena (UAP) approaches, one wonders what happens next? What will we learn, and will it fundamentally change our understanding of the phenomenon?

It can be argued that disclosure began with the release of three videos by the US Navy this past year, followed by additional videos by the Chilean Navy, and Department of Homeland Security. That the videos were released through official channels suggests the data are genuine. Analysis of these and other data indicate that UAP are a measurable physical phenomena, and certain objects such as the “tic-tac” exhibit behaviors that violate the laws of physics (see Luis Elizondo’s list of five observables).
Official responses to these disclosures emphasize there is no evidence that UAPs are extraterrestrial. The extraterrestrial question has become somewhat of a “red herring” due to the central role it has taken on in the debate over both the search for extraterrestrial life (SETI) and the possible origin of UFOs. The noted UFO researcher Jaques Vallee emphasizes the need to study the phenomenon without assuming it is extraterrestrial in origin. To this end, he has proposed that a data warehouse of UFO report databases from across the world be established to study the phenomenon from a global perspective in order to detect trends and patterns in the data.
A Data-Driven Analysis of UFO reports
A preliminary analysis of reports in one of these databases maintained by the National UFO Reporting Center reveals some interesting facts that may not be well-known. These facts are not based on a single sighting or experience but on the analysis of more than 90,000 UFO reports over the past eighty years.
A Long-Term Trend
In considering global patterns (at least within the US), are there any overall patterns that emerge from the available data? Popular articles citing UFO report statistics tend to focus on short-term trends such as the decrease in the number of sightings in 2015 followed by the rapid increase in 2018. Stepping back and examining the data over a longer period reveals a much more interesting trend (see graph below). Over this period UFO sightings have increased at an exponential rate, doubling in number, on average, every 6.3 years. In this same period, the US population increased at a much lower rate from 132 million to 330 million people. The lack of correlation between the growth in the number of UFO reports and US population suggests the rate at which UFOs are being reported does not depend on the number of people unless one is willing to concede that the average observer is a thousand times more likely to see a UFO now than in 1940.

Interest in Human Populations
Analyzing reports by state reveals a high degree of correlation with state population, i.e., the number of reports per state is related to the number of people in that state. One possible explanation is that states with more people have more sightings because there are more people available to witness a UFO, but this conflicts with the national trend discussed above. Another explanation is that UFOs occur more frequently in places where there are more people.
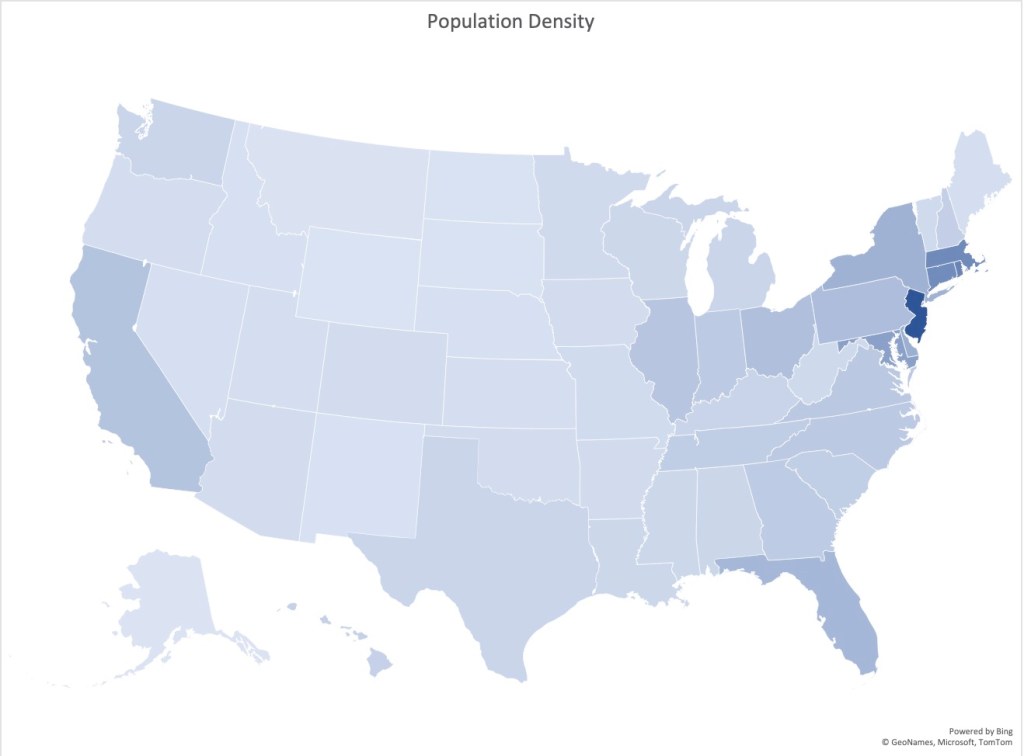

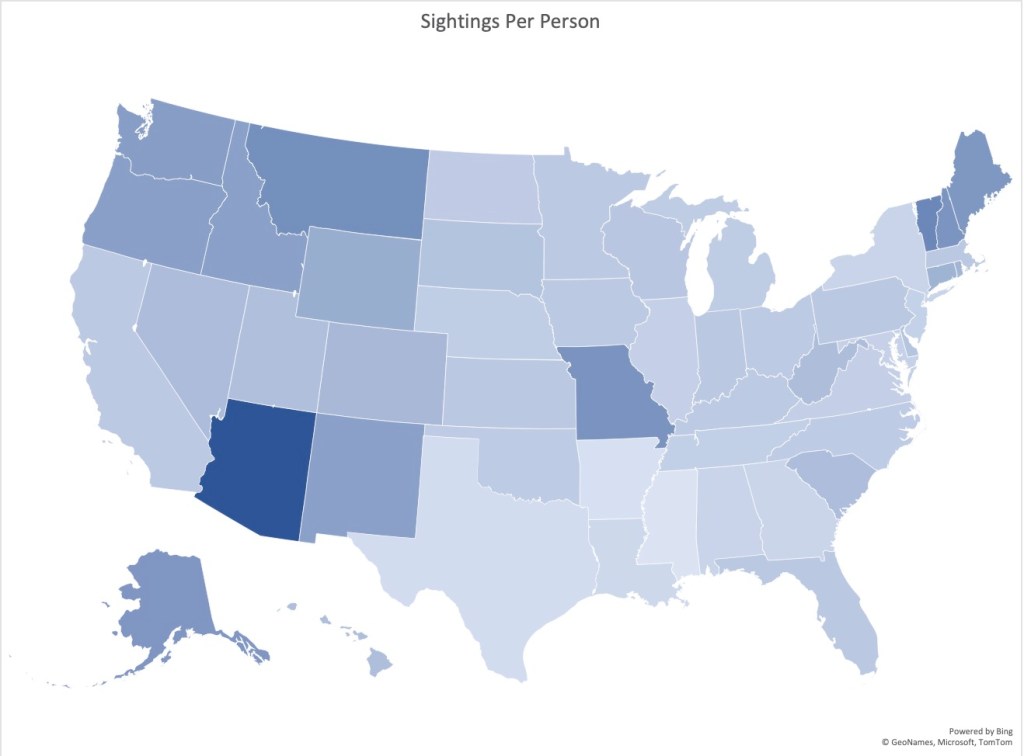
We can test this hypothesis by comparing the number of UFO reports per capita per state to the state’s population density, as shown above. If we compare maps of population density (persons per sq. km) with the density of sightings (number of sightings per sq. km), notice the two maps appear to be highly correlated. This suggests that, on average, UFOs favor areas with more people.
Some places have fewer sightings than expected while others have more. For example, Arizona has more than three times more reports per capita than, say, Ohio. One explanation is that besides human populations, UFOs may be interested in other places such as nuclear weapons facilities.
An Evolving Phenomenon
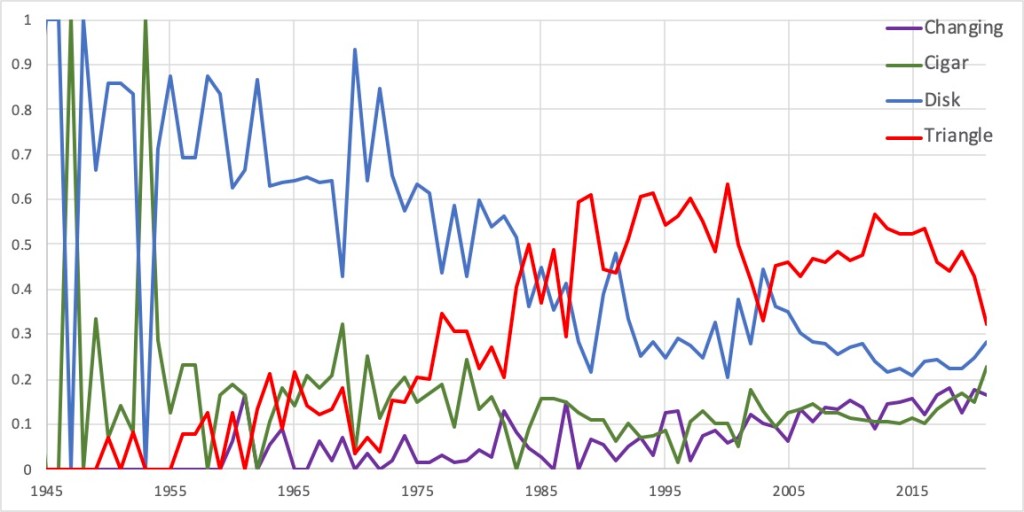
It has been noted that the UFO phenomenon appears to have evolved over time, perhaps as a result of our response to it. The NUFORC database classifies UFO reports into twenty shapes. The figure below plots the relative frequency of four of the UFO shapes: disks, triangles, cigars, and changing shapes observed between 1940 and 2020. Prior to 1985, the classic disk shape of a flying saucer was sighted more frequently than the triangular shape, which today is seen more frequently.
The results presented here barely scratch the surface of what can potentially be gleaned from existing databases of UFO reports. Future work will apply automated algorithms to search for additional correlations/patterns in the data, and natural language understanding algorithm to deduce, by statistical means, answers to key questions such as purpose and intent.
Featured image at the top of the article from the movie Mars Attacks.
